Sysquake Pro – Table of Contents
Sysquake for LaTeX – Table of Contents
Introduction to Sysquake
This chapter introduces to the application Sysquake, the interactive design CAD tool for getting insight into complicated scientific problems and designing advanced technical devices. You should read it to know more about what Sysquake is, what it may be used for, and how to use it for simple tasks.
Introduction
To design technical devices, or to understand the physical and mathematical laws which describe their behavior, engineers and scientists frequently use computers to calculate and represent graphically different quantities, such as the sample sequence and the frequency response of a digital audio filter, or the trajectory and the mass of a rocket flying to Mars. Usually, these quantities are related to each other; they are different views of the same reality. Understanding these relationships is the key to a good design. In some cases, especially for simple systems, an intuitive understanding can be acquired. For more complicated systems, it is often difficult or impossible to "guess", for instance, whether increasing the thickness of a robot arm will increase or decrease the frequency of the oscillations.
Traditionally, the design of a complicated system is performed in several iterations. Specifications can seldom be used directly to calculate the value of the parameters of the system, because there is no explicit formula to link them. Hence each iteration is made of two phases. The first one, often called synthesis, consists in calculating the unknown parameters of the system based on a set of design variables. The design variables are more or less loosely related to the specifications. During the second phase, called analysis, the performance of the system is evaluated and compared to the specifications. If it does not match them, the design variables are modified and a new iteration is carried out.
When the relationship between the criteria used for evaluating the performance and the design parameters is not very well known, modifications of the design parameters might lead as well to poorer performance as to better one. Manual trial and error may work but is cumbersome. This is where interactive design may help. Instead of splitting each iteration between synthesis and analysis, both phases are merged into a single one where the effect of modifying a parameter results immediately in the update of graphics. The whole design procedure becomes really dynamic; the engineer perceives the gradient of the change of performance criteria with respect to what he manipulates, and the compromises which can be obtained are easily identified.
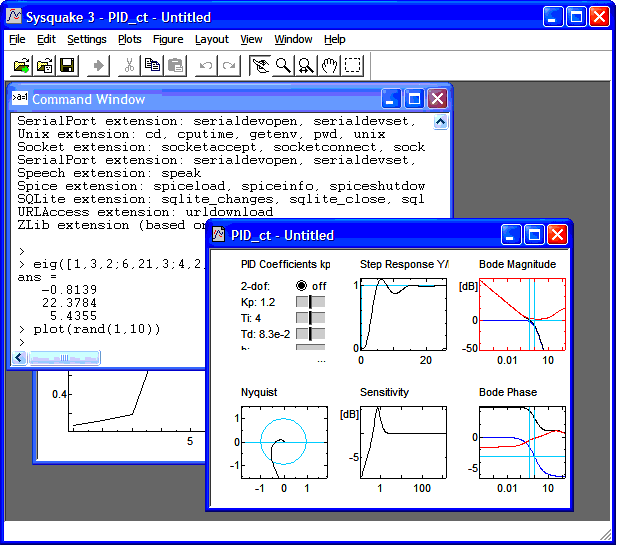
Sysquake's purpose is to support this kind of design in fields such as automatic control and signal processing. Several graphics are displayed simultaneously, and some of them contain elements which can be manipulated with the mouse. During the manipulation, all the graphics are updated to reflect the change. What the graphics show and how their update is performed are not fixed, but depend on programs written in an easy-to-learn language specialized for numeric computation. Several programs are included with Sysquake for common tasks, such as the design of PID controllers; but you are free to modify them to better suit your needs and to write new ones for other design methods or new applications.
Another area where Sysquake shines is teaching. Replacing the static figures you find in books or the animations you see on the Web with interactive graphics, where the student can manipulate himself the curves to acquire an intuitive understanding of the theory they represent, accelerates and improves the learning process tremendously.
How Sysquake can be used
Sysquake is expected to be used mainly for three different purposes.
- Understanding basic concepts
- In science as well as in engineering, theory is often not very intuitive at first, because it relates quantities from different domains: energies and positions, time and frequency, temperatures and entropies. In automatic control, where feedback is used to improve performance of any kind of system, transient behavior, such as settling time, overshoot, and risk of actuator saturation, is typically analyzed in the time domain; while the stability, noise rejection, and different kinds of robustness are more easily expressed in the frequency domain. The basic mechanisms which relate these quantities can be illustrated very effectively with Sysquake.
- Designing systems
- The quality of a device is always the result of a compromise. Multiple objectives, such as the speed, the accuracy and the cost, must be taken into account simultaneously and have contradictory requirements. Sysquake helps a lot to find which compromises are feasible, how to push the design in the desired direction, and how to modify the specifications in case they do not permit a satisfying solution.
- Developing and testing new design methods
- Some design methods still in use were developed at the time when computers were either nonexistent or too expensive, or too slow for interaction. While they can also benefit from Sysquake, they are better complemented or replaced by approaches which offer more degrees of freedom for better performances. A lot of work can undoubtedly be done in this field.
There is more or less a one-to-one correspondence between these application fields and the ways Sysquake can be used.
- Ready-to-use interactive figures
- A static figure which illustrates a basic concept in a book or a course on the World Wide Web can be replaced with a dynamic figure, where the reader manipulates an element and sees its effect. For instance, to show how the height of a building influences the amplitude of its oscillations during an earthquake, the student is invited to change the building height with the mouse and see how the earthquake simulation is modified. To support this (and much more complicated interactive figures), Sysquake loads an SQ file, a text file which contains the description of the figures and the code necessary to support the interaction. SQ files do not have to handle advanced features provided automatically by Sysquake, like multiple undo, zoom, and scale options. They rely on built-in functions for graphics related to linear dynamic systems, but can also compute and display arbitrary data with a complete language.
- Set of programs for different design or analysis methods
- SQ files are not limited to a fixed set of figures and interaction. They can implement all that is needed for a given design or analysis approach. Then the user chooses what he wants to display, may enter numeric parameters which characterize the problem, and manipulates the graphics until he obtains the desired results. He can also save the parameters of his design in an SQD file (Sysquake Data file) and load them later.
- Programs written from scratch
- The applications described above are based on SQ files, which either come from those distributed with Sysquake or are contributed by other users, or are written from scratch. Developing an SQ file is not difficult; however, it requires some programming knowledge and experience. For small problems, a simpler programming model is available, SQ scripts.
These purposes are the
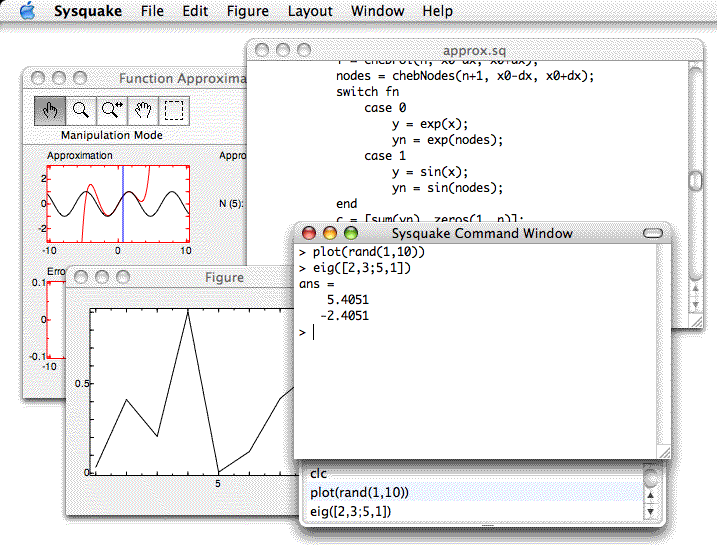
Another advantage of Sysquake is that it runs on
both Windows

