Demographic evolution with Sysquake
Sysquake lets you understand quickly and easily the effect of parameters on the evolution of a complex system. As an example, here is a simulation of the evolution of the Swiss population, starting with the data collected during the last census in 1990.

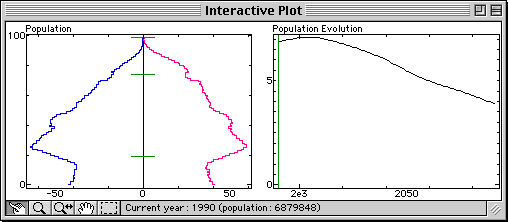
The left figure shows the 1990 population pyramid, which corresponds exactly to the census of 1990; women are displayed in pink and men in blue, between 0 and 99 years old. The right figure shows how the Swiss population will change in the next century if the birth and death rates are fixed. You can see a maximum at about 7.1 millions people in 2004; then the population decreases, forever if the birth and death rates remain constant.
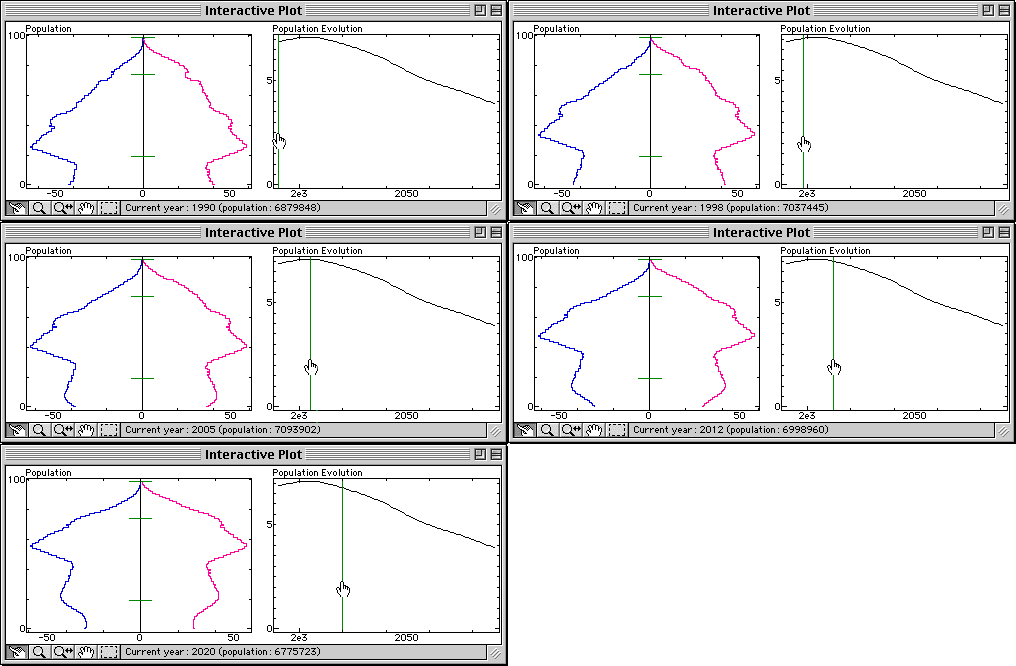
What will be the shape of the population pyramid in 2020? Here Sysquake shows its real power. Just drag the vertical green line in the right figure and look how the left figure is updated continuously (in this web page, interaction is replaced by coarse animations; just look at the figures).

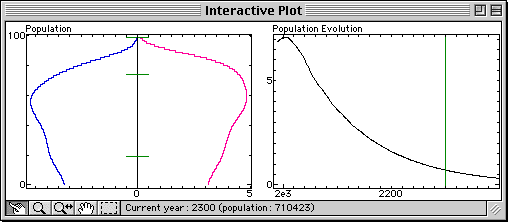
What can we observe? Since about 1968, the birth rate has dropped. About 20 years later, there are suddenly much less women who can become mothers, so the number of babies drops a second time; and so on until the ripples are damped, as we can see by continuing the simulation until 2300 (changing the time scale of the population evolution graphic is necessary, which requires two or three mouse clicks). Of course, a lot of things can happen in the meantime, and a Swiss population of 700,000 in 2300 is extremely uncertain; but you get a good understanding of how this simple demographic model works.

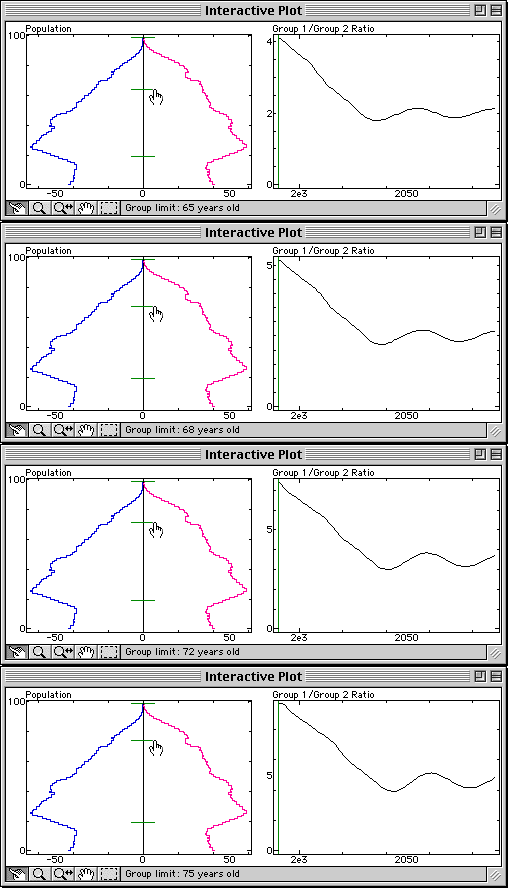
What else can be observed? In the near future, a big problem is to get enough money from active people to pay pensions to retired people. In Switzerland, the current retirement age is 65 for men, and 64 for women. As a slight simplification, optimistic as far as paying pensions is concerned, let us set the retirement age to 65 for everybody. The ratio between active people (20-64) and retired people (65 and older) indicates how much active people should pay in a system where the money is not invested, but used immediately (as is the case for a part of Swiss pensions and in many other countries). Let us replace the right graphic with the evolution of this ratio.

It drops from 4 to about 2; to keep the same net salary before and after retirement, active people will have to pay about one third of their salary. What can be done? Unless birth and death rates change, there is a simple remedy: increase the retirement age. In the population pyramid, the three short horizontal lines represent the limit age of the two groups. With the mouse, drag up the middle line and observe what happens:

At 75, the ratio stabilizes to about 5, which is much better.
Sysquake Pro and Sysquake come with this demographic application. With them, you can:
- manipulate graphics yourself the way you want, with much smoother results;
- change other parameters, such as the birth rate;
- observe other quantities, such as the evolution of children;
- use features such as multi-level undo, printing, EPS output (Sysquake only), etc.
- study the algorithms used in the demographic application by reading the source code, and modify it;
- load other applications in domains such as automatic control, signal processing, physics, etc.
- develop your own applications by writing script files.
You can download now Sysquake, which includes this demographic example.
Warning: the demographic model is based on very simple assumptions and is not suited as a decision-aiding tool. No guarantee is made with regard to the model, the demographic data, the simulations and their interpretation.