Disponible uniquement en anglais
Sysquake Pro – Table of Contents
Sysquake for LaTeX – Table of Contents
convolution.sq
Convolution and correlation of signals
SQ file convolution.sq illustrates how convolution and correlation products are
calculated

First contact
The convolution product of two signals
![]()
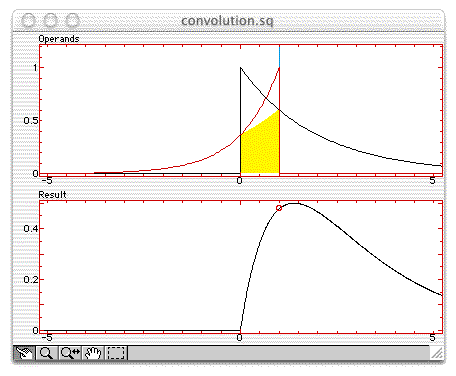
When convolution.sq is opened, the convolution product of two exponential
signals is performed. The upper figure shows the integral for a given value of
Settings
In the Settings menu, you can switch among several pairs of signals. You
can also display the correlation of an exponential with itself (autocorrelation),
or the correlation between a square corrupted by noise with a square
(signal detection). The correlation is similar to the convolution product;
the differences are that no signal is flipped, and the result is a function
of the shift
![]()
Squares
Convolution between two squares of the same length.
Exponentials
Convolution between two exponential signals with different time constants.
Delayed Exponential
Convolution between an exponential and a delayed Dirac impulsion, which yields a delayed exponential.
Echo
Convolution between an exponential and two Dirac impulsion, which yields an exponential with an echo.
Step Response
Convolution between a step and an exponential; if the exponential is the impulse response of some first-order system and the step is its input, their convolution product is the system output (the step response of the first-order system).
Autocorrelation of Exponentials
Autocorrelation of an exponential, which yields a symmetric function with a maximum at 0.
Signal Detection
Cross-correlation between a square signal corrupted by noise and a pure square. Despite the high level of noise, the result shows a clear maximum which indicates when the square occurs.
Figures
First/Second Operand
The operands of the convolution product or the arguments of the correlation product are displayed. They cannot be manipulated.
Operands
The operands of the convolution or the arguments of the correlation
are displayed. For the convolution, the second operand is displayed
backward and can be shifted by a value of
Result
The result (convolution or correlation) is displayed in black, with a red circle to highlight the value corresponding to the shift represented in the Operands figure. This circle can be dragged interactively.