Disponible uniquement en anglais
Sysquake Pro – Table of Contents
Sysquake for LaTeX – Table of Contents
ARW.sq
Effect of saturation and antireset windup in a closed-loop system
In linear control, the system to be controlled and the controller are both supposed to be linear. This simplifies tremendously the design, and permits the use of powerful techniques such as transfer functions and frequency responses. In reality, however, the linearity hypothesis is only an approximation. For systems which are physically close to a linear system, such as electrical drives, the most important non-linear effect comes often from the limited amplitude of the actuator input. Especially when the controller has an integrator effect, the performances can deteriorate by a large amount, or the loop can even become unstable. This is so because the error between the measured output and the set-point remains large much longer than if the system input had effectively the value the controller tries to set, and makes the integral term become large. When the sign of the error eventually changes, a long time is required to "empty" the integrator. This leads to slow oscillations. The anti-reset windup (ARW) prevents this effect by stopping integration when saturation occurs.
ARW.sq illustrates the effect of the ARW on systems controlled with
discrete-time PI (proportional-integrator) controller

First contact
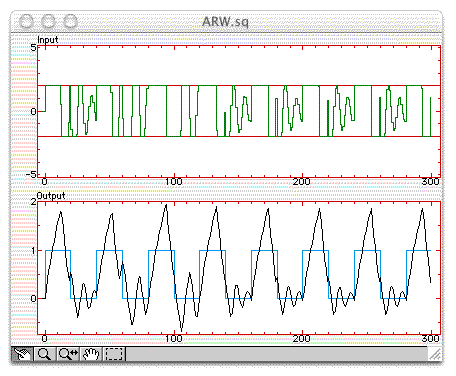
When you open ARW.sq from Sysquake (menu File/Open), two figures are displayed: the system input and system output responses of a first-order system with a proportional-integrating controller. In the input response, the red lines correspond to saturation; they can be moved up and down with the mouse. In the output response, the curve in cyan (light blue) is the reference signal, a square signal. You can change its frequency by clicking it and moving the mouse to the left or to the right. Observe how the output fails to follow the reference signal when you reduce the saturation level. In the Settings menu, select ARW, and observe the improvements: the input signal saturates much less and changes as soon as the reference signal switches, because the integrator does not have to be slowly emptied.
Figures
Input
The system input (control signal) is displayed in green, and the saturation limits as horizontal red lines. The saturation can be manipulated interactively.
Output
The system output is displayed in black, and the set-point in cyan. The set-point is a square signal whose frequency can be changed interactively.
Settings
System
A discrete-time model is given as two row vectors which contain the numerator and denominator of a transfer function.
Sampling Period
The sampling period
PI Controller
The transfer function
![]()
where
ARW
The anti-reset windup (ARW) is enabled or disabled.
Set-Point Frequency
The frequency of the set-point can be set by giving the number of samples of half its period.
Simulation Length
The length of the simulation is specified as a number of samples.